I’ve used the words “money printing” and “currency debasement” in half a dozen articles on this site without ever properly explaining what they mean. In Why a 12% Annual Return Is Essential to Maintain Your Purchasing Power, I built our whole return hurdle around “8% global liquidity growth.” In Why Circle Has a Money Printing Business Model, I described a company that earns over a billion dollars a year by holding reserves that pay it interest, while paying its own users nothing. In Bitcoin Has Peaked, I attributed a big chunk of the recent drawdown to the Fed “withdrawing $2.4 trillion from the financial system.” I’ve asked you to trust those numbers without ever showing you where they come from.
Although I studied 3 Unit Economics, this is likely not the case for many readers. So this is the explainer piece I should have written first. How does a central bank actually create money, why does a government need to borrow at all if it controls the currency, and what does any of this have to do with the return your portfolio needs to clear just to stand still?
I’ll start with the structure in the USA and then how it relates back to Australia.
Three institutions, three jobs
Almost everything below comes down to three separate institutions, each with a distinct role, kept apart on purpose.
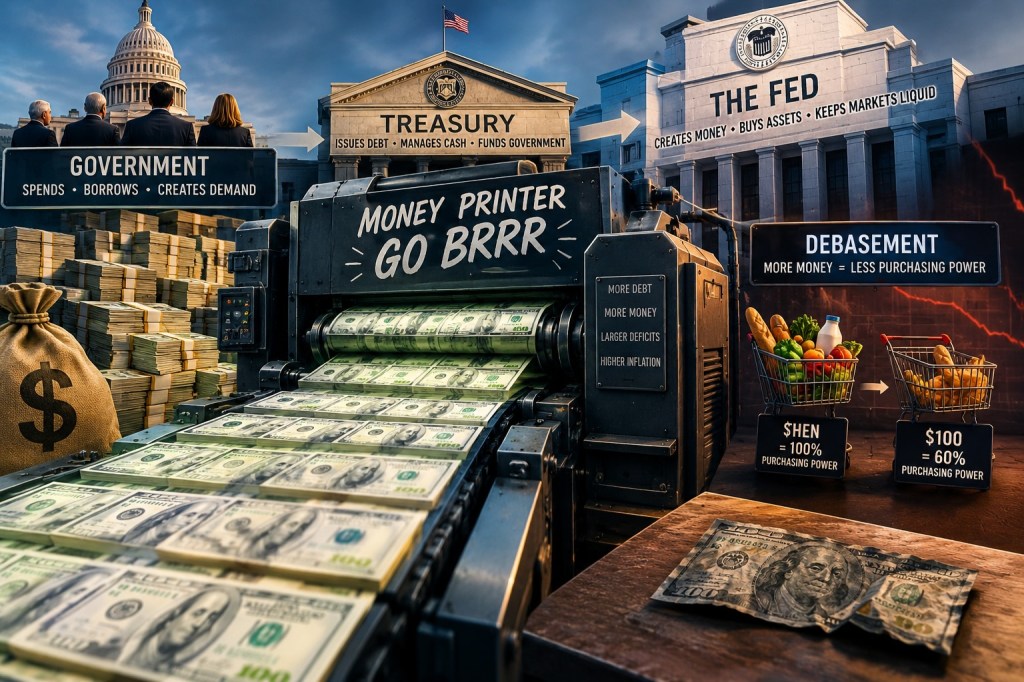
The US Government – Congress and the executive branch – decides fiscal policy: what to spend, what to tax, and how large a deficit the budget is allowed to run. It passes the laws that authorise spending. It does not itself borrow money or create money.
The US Treasury is the government’s financing arm. When Congress spends more than it collects in tax, the Treasury is the department that goes into the market and borrows the shortfall – auctioning debt securities to cover the gap and managing the resulting national debt day to day. The Treasury borrows and repays. It does not set interest rates and it does not create money.
The Federal Reserve is the central bank, and it is deliberately kept independent of the other two. It sets interest rates and manages the money supply – monetary policy – and is structured to make those calls without instruction from Congress or the White House. That independence isn’t an accident. A government that could print its own way out of debt would have every short-term incentive to do so before an election, and the inflation that follows is exactly what an independent central bank exists to resist (think Argentina or Zimbabwe).
Keep that three-way split in mind through everything that follows. The government decides how much needs to be borrowed. The Treasury does the borrowing. The Fed sets the price of money and, separately, decides whether to expand or shrink its own balance sheet. Three institutions, three jobs, and none of them answer to the same people.
Part one: how it works in the United States
The deficit is cumulative. The US federal government runs a deficit most years – tax revenue doesn’t cover the spending Congress has authorised, so the gap gets borrowed. Each year’s deficit adds to the national debt, which the Treasury has to keep rolling over and adding to.
The Treasury borrows to cover the gap. It auctions debt securities to banks, pension funds, foreign governments and individuals: Treasury bills (under a year), notes (2 to 10 years) and bonds (20 to 30 years). Buying one is lending money to the US government, which repays the face value at maturity plus periodic interest.
Price and yield move in opposite directions. Once issued, these securities trade in a secondary market and their price moves with demand, even though the payments they promise are fixed. A 10-year note paying a $40-a-year coupon on $1,000 face value becomes a better deal if the price falls to $900 (the yield rises) and a worse deal if the price climbs to $1,100 (the yield falls). This seesaw is the single most useful fact to carry through the rest of this piece, because it’s what a “rate rise” or a “bond sell-off” actually is underneath the headline.
The fed funds rate is the lever on the short end. The Federal Reserve sets a target for the rate banks charge each other on overnight loans, largely by controlling the interest it pays banks on the reserves they hold with it. That single rate anchors the short end of the curve – a bank won’t buy a 3-month bill yielding less than it can already earn risk-free overnight, so short-term yields trade in a tight band just above the funds rate. As of late August 2026, the effective fed funds rate sits at 3.63%, down from the 5.33% peak of the 2023 tightening cycle, with 3-month bills around 3.85% and the 10-year note around 4.66
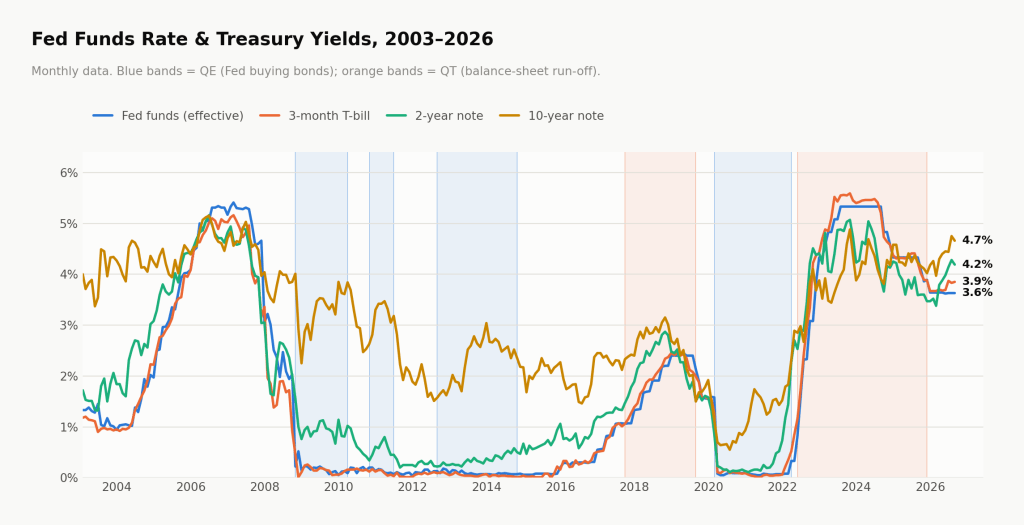
Fed funds rate, 3-month T-bill, 2-year note and 10-year note, 2003-2026, with QE and QT periods shaded Monthly data, January 2003 – August 2026. Blue bands mark QE (the Fed buying bonds); orange bands mark QT (the balance sheet shrinking). Notice how the short end (fed funds, 3-month bills) tracks the funds rate almost exactly, while the 10-year moves on its own logic.
QE and QT are the lever on the long end – and this is the actual “money printing.” Further out the curve, the funds rate’s grip loosens. The 10-year and 30-year care more about long-run inflation expectations and how much government debt is being issued relative to who wants to buy it. This is where quantitative easing (QE) and quantitative tightening (QT) operate.
The mechanics are worth sitting with, because they surprise most people. When the Fed runs QE, it doesn’t spend money it already has. It creates new bank reserves electronically and uses them to buy Treasuries from primary dealers in the open market. The dealer’s account at the Fed is simply credited with new reserves that didn’t exist a moment earlier; the bond moves onto the Fed’s own balance sheet.
Both sides of the balance sheet grow out of nothing, which is the literal mechanism behind “money printing,” even though nothing physical gets printed.
The Fed can do this because it is the issuer of the currency the whole banking system settles in. This is the same trick, structurally, that I described Circle running with USDC reserves – hold an asset that earns yield, fund it with a liability that doesn’t, and the spread is yours. The Fed just does it at the scale of the entire monetary system rather than one stablecoin.
The numbers make the scale concrete. The Fed’s balance sheet sat under $1 trillion before 2008. Four rounds of QE – the 2008 crisis, 2010-11, 2012-14, and the much larger COVID response – took it to a peak of $8.94 trillion in April 2022. QT then ran the mechanism in reverse, mostly passively: the Fed let its holdings mature and declined to reinvest the proceeds rather than selling into the market. By the time that run-off ended in December 2025, the balance sheet had fallen to roughly $6.6 trillion – a withdrawal of close to $2.3 trillion, which is the figure I cited in Bitcoin Has Peaked as one of the biggest headwinds working against crypto and risk assets through that entire cycle. As of August 2026 the balance sheet sits at $6.73 trillion, and – as I noted in that same article – the Fed has since ended QT and moved back to buying roughly $40 billion a month in Treasuries. That’s the liquidity tailwind underpinning my view that the next leg higher in Bitcoin starts once the current drawdown finds its floor.
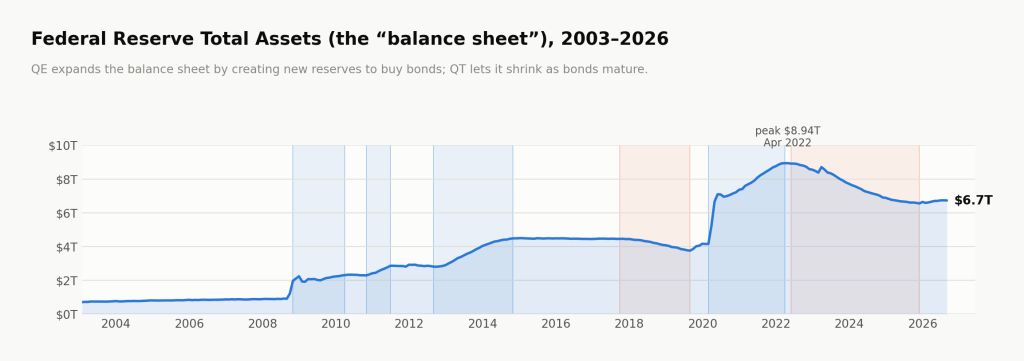
Federal Reserve total assets (the “balance sheet”), 2003-2026, showing four QE episodes and two QT run-offs The balance sheet in dollar terms – this is the chart that makes “money printing” literal. Each QE episode is a step up as the Fed creates reserves to buy bonds; each QT episode is a slow decline as those bonds mature and the Fed doesn’t replace them.
Part two: how it works in Australia
Australia runs the identical system with its own vocabulary. The Reserve Bank of Australia is the central bank; its Monetary Policy Board sets the cash rate, our equivalent of the fed funds rate, held at 4.35% at the RBA’s August 2026 decision. It implements that rate the same way the Fed does – by setting the interest it pays on the electronic reserves banks hold with it. In Australia those reserves are called Exchange Settlement (ES) balances, held in Exchange Settlement Accounts by authorised deposit-taking institutions (ADIs). When the RBA buys a government bond, it credits the seller’s ES account with newly created balances, exactly as the Fed credits a primary dealer’s reserve account – nothing pre-existing is spent, the RBA’s own balance sheet just grows on both sides.
The RBA ran its own version of QE through the pandemic, the Bond Purchase Program, buying Commonwealth and state bonds from November 2020 through early 2022. Its version of QT has also been passive: since May 2022 the Board simply hasn’t reinvested maturing proceeds, letting the portfolio run off on its own schedule as those bonds mature through to 2033.
| Concept | United States | Australia |
|---|---|---|
| Central bank | Federal Reserve | Reserve Bank of Australia |
| Policy interest rate | Federal funds rate | Cash rate |
| Rate-setting committee | FOMC | RBA Monetary Policy Board |
| Reserves created to buy bonds | Bank reserves | Exchange Settlement balances |
| Institutions holding those accounts | Primary dealers / banks | ADIs |
| Government debt manager | US Treasury | AOFM |
| 2020-21 bond-buying program | Pandemic QE | Bond Purchase Program |
This equivalence isn’t a coincidence, it’s structural. Any country that issues and controls its own currency – the US, UK, Japan, Canada, Australia – can run this same playbook, because its central bank can create the settlement money its own banking system uses. It doesn’t work for a country that doesn’t control its own currency, a eurozone member or a dollarised economy, because its central bank can’t unilaterally create the money everyone in its system ultimately settles in.
This is the engine behind the 12% hurdle rate
Here’s the connection I should have drawn eighteen months ago. In the 12% return article, I broke the hurdle down into roughly 8% global liquidity growth plus 4% inflation. Everything above is what “8% global liquidity growth” actually is. It’s the Fed’s balance sheet expanding by trillions in four separate QE episodes since 2008. It’s commercial banks creating new deposits every time they extend credit. It’s the RBA crediting ES accounts with balances that didn’t exist a moment earlier. None of that liquidity is evenly distributed – it flows disproportionately into scarce, investable assets: equities, real estate, and anything with a genuinely capped supply. That’s the mechanical reason a portfolio sitting in cash quietly loses ground even in years when nothing appears to be going wrong, and why our own Family Trust target has always been set meaningfully above the level a textbook would call “safe.”
It’s also the reason QE and QT cycles show up so often in my crypto writing. Understanding Crypto’s 4-Year Cycle and Technology Has Been Eating the World both leaned on Bitcoin’s correlation with global liquidity to explain why it has outperformed the Nasdaq so dramatically since the debasement era began. That correlation isn’t a coincidence or a chart-fitting exercise. Bitcoin has a fixed, algorithmically enforced supply, so it is close to the purest possible asset for absorbing new liquidity without anyone being able to dilute the float in response. Every dollar the Fed or the RBA creates has somewhere to go, and a hard-capped asset is structurally one of the places it goes hardest. The same logic explains why Riding the Long Waves framed the post-2008 secular bull market, at 16.6 years and counting, as the second-most profitable in a century – it has run almost exactly alongside the four biggest liquidity injections in Fed history.
And it’s why the QT-then-QE turn matters so much for where I think Bitcoin goes from here. The $2.3 trillion the Fed pulled out of the system between mid-2022 and the end of 2025 was a genuine headwind sitting underneath every other catalyst I listed in Bitcoin Has Peaked – the ETF approvals, the Strategic Bitcoin Reserve, the GENIUS Act. All of that good news was fighting a shrinking pool of liquidity the entire time. That fight is now over. The Fed is buying again, at roughly $40 billion a month, at the same time my own indicators point to a bottom forming later this year. A resumption of balance sheet growth, layered on top of a market already digesting the AI capital rotation and the mega-IPO liquidity drain, is exactly the kind of tailwind that has preceded every major leg higher since 2009.
Why the plumbing is worth knowing
None of this tells you what rates or Bitcoin will do next week – nobody gets that consistently right, and I’ve been wrong on timing before. What it does is turn a “Fed balance sheet” headline, a curve inversion, or an RBA statement from background noise into information you can actually use, because you can see the mechanism sitting behind the number. The next time I write that liquidity is expanding, or that debasement is accelerating, or that a hurdle rate needs to move, this is the machine I’m describing. I wanted it written down properly, once, so every future article can point back here instead of asking you to take the plumbing on faith.