As per our plan around timing the exit of this crypto cycle, outlined below is where the indicators are currently tracking.
New Indicators – Bitcoin Cycle Risk Framework
We’ve decided to incorporate some additional indicators courtesy of Jamie Coutts over at RealVision.
The Bitcoin Cycle Risk Framework by Jamie Coutts is a data-driven model designed to assess where Bitcoin sits within its market cycle by integrating macro, market structure, and behavioural indicators. It doesn’t aim to predict tops or bottoms precisely, but rather to highlight when risk is building or receding.
The framework is based on 3 core metrics outlined below. Each metric is scored out of 5 with past BTC peaks being realised when all 3 indicators reach 5 out of 5.
Global Liquidity Risk Score (GRS)
Measures Bitcoin’s price relative to global liquidity conditions. A high GRS signals overvaluation; a low score suggests undervaluation and potential upside.

Current Status: 3 out of 5
2. Derivatives Risk Score (DRS)
Tracks leverage and positioning stress via open interest and funding rates. High DRS = speculative risk; low DRS = healthy market foundation.
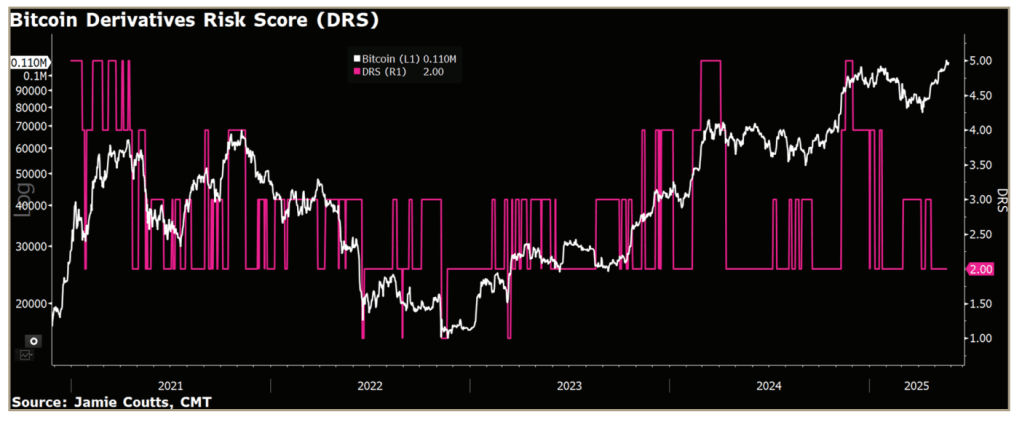
Current Status: 2 out of 5
3. Network Profitability Risk Score (NPRS)
Gauges on-chain profit-taking behavior using MVRV, NUPL, and LTH-SOPR. High NPRS indicates widespread unrealised gains and potential for distribution; low NPRS suggests capitulation and buying opportunities.
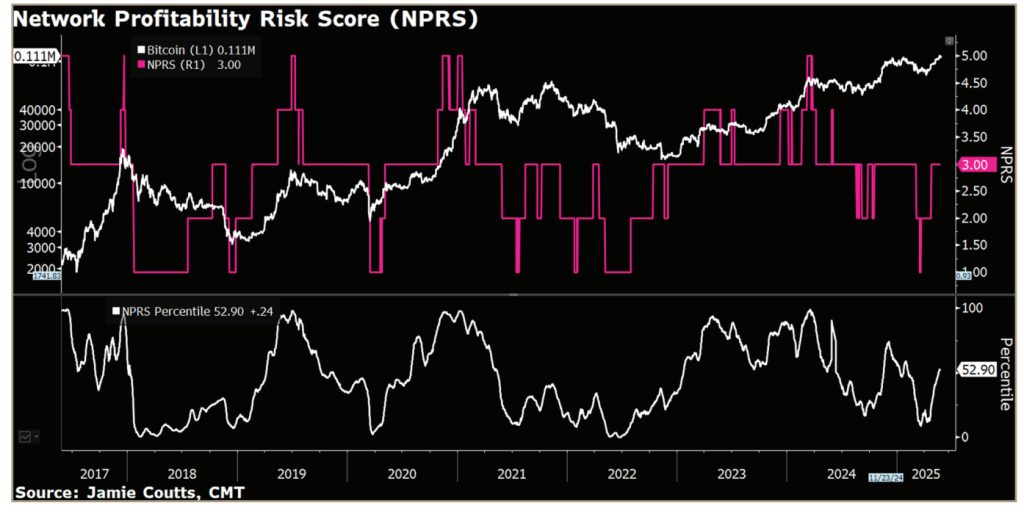
Current Status: 3 out of 5
Together, these scores offer a holistic view of Bitcoin’s risk environment across liquidity, leverage, and investor behavior.
Current Value of Factors
Historic Cycle Timings

Still aiming for a cycle peak towards the end of 2025 as can ben seen by this graph.
Market Sentiment
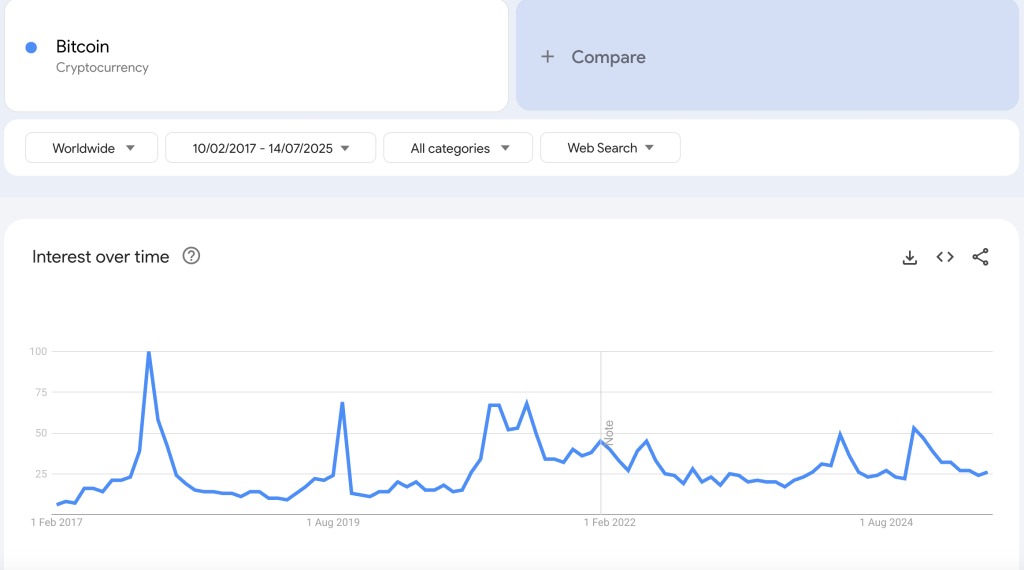
Google trends over a long term timeframe (since 2017) currently sits at 26 which is below the previous 2 peaks (100 in 2017 and 69 in 2021). Until this peaks above 60 over the long term range I believe there is still room to run.
Macro-Economic Factors
Here are 4 key macro indicators………courtesy of RealVision, that provide valuable insight into where we are in the Bitcoin cycle:
1. Bitcoin 3Mo3M% vs. GMI Financial Conditions Index
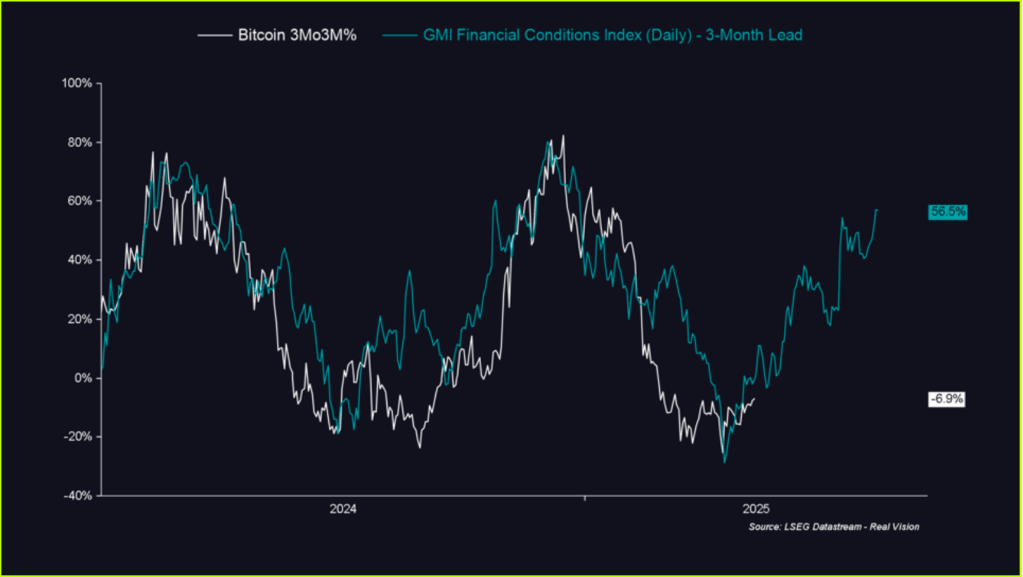
Historically, Bitcoin price action lags financial conditions by about three months. The GMI Financial Conditions Index bottomed in Q4 2024, and Bitcoin followed with a bottom in Q1 2025.
Based on previous patterns, the level of easing we’re seeing now implies that by the end of this quarter, Bitcoin could be up approximately 50%. This isn’t speculation……..it’s a repeatable relationship between easing conditions and delayed price reactions.
As RealVision often reminds us: everything else—tariffs, headlines, noise—is downstream of financial conditions.
2. Global M2 vs. Bitcoin
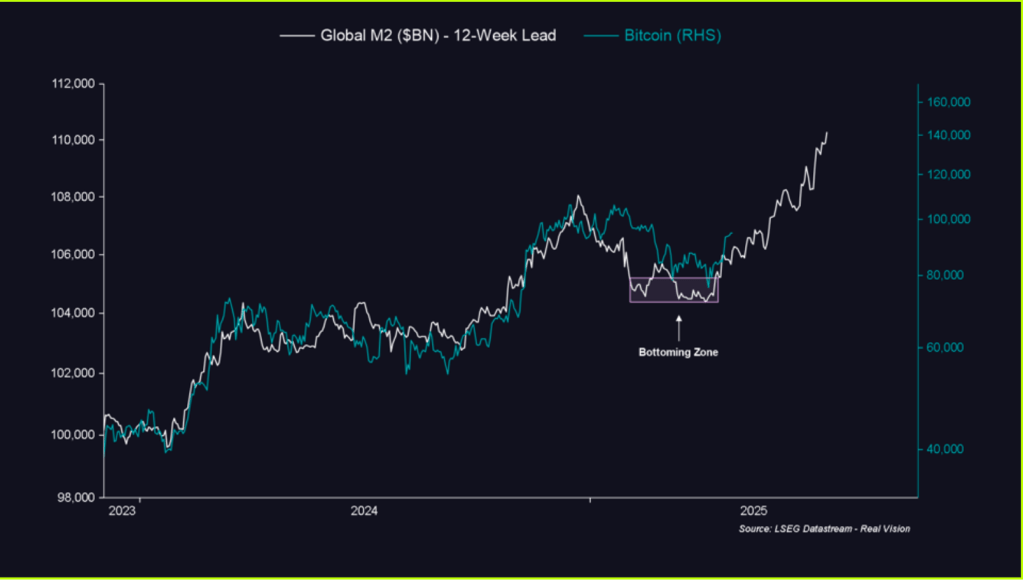
Another strong macro signal comes from the Global M2 money supply. Bitcoin typically lags changes in M2 by around 12 weeks. Global M2 bottomed in late Q4 2024 and began rising in January 2025, putting Bitcoin’s March rebound right on schedule.
If this trend holds, April marked the beginning of the next upward leg……and so far, that’s playing out as expected, with Bitcoin already showing renewed momentum.
3. Bitcoin Cycle Phases: The “Banana Zone”
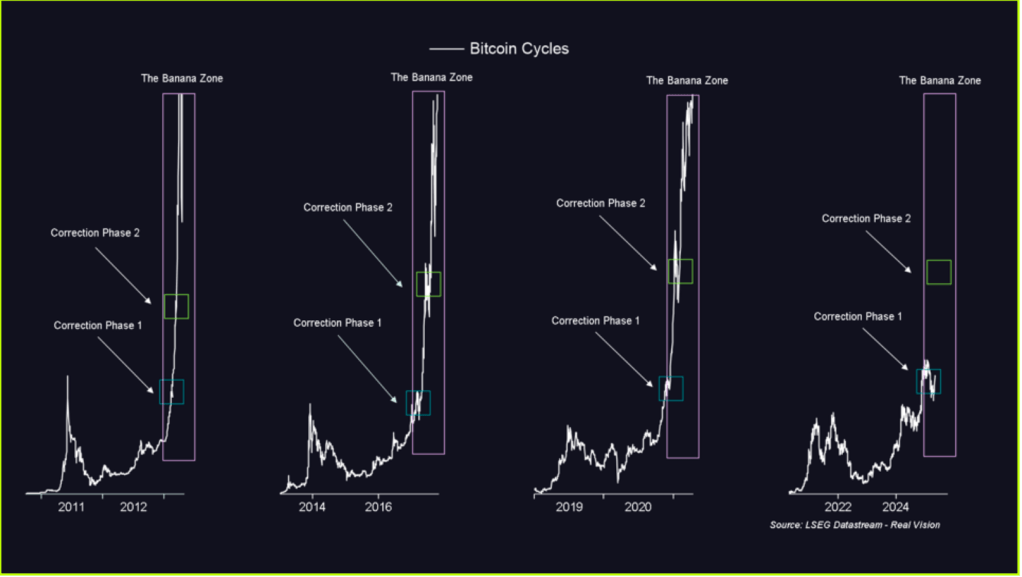
Finally, a look at the historical behavior of Bitcoin itself. According to RealVision, Bitcoin cycles go through identifiable phases—including what they call the “Banana Zone,” where price action turns parabolic.
We’re now entering Phase 2 of that Banana Zone, a stage historically marked by steep upward movement. While short-term pullbacks are part of any healthy cycle, all signs point to the next few months being especially bullish.
4. ISM vs Bitcoin Implied Price
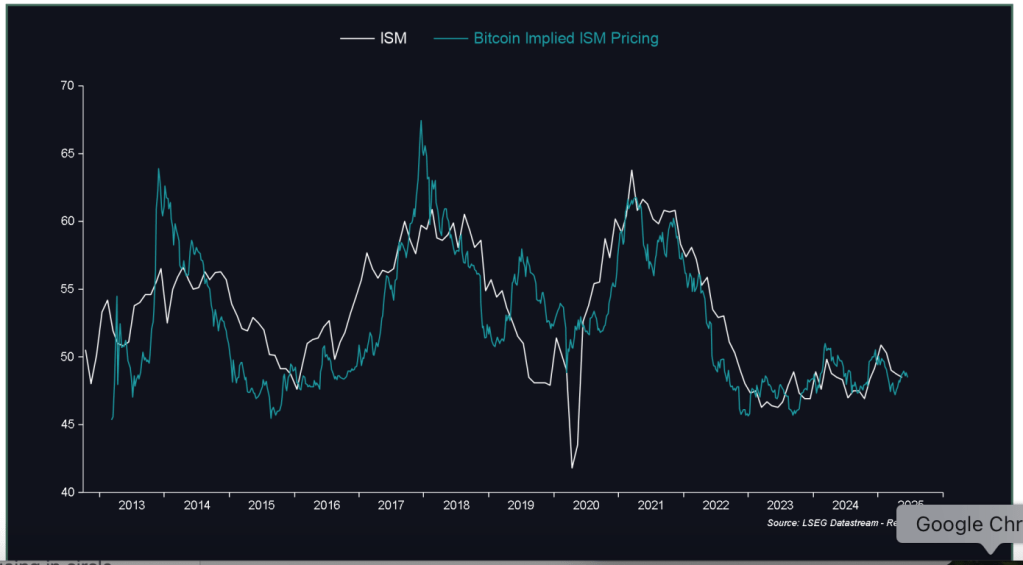
Until the ISM reaches 57, BTC is currently underpriced and below other cycle peaks.
On-Chain Indicators
At present values, 0 out of 17 indicators have turned on.
| Indicator | Peak Value | Current Values | May 15 Values | Feb 15 Values |
|---|---|---|---|---|
| Puell Multiple | 3.5 | 1.44 | 1.37 | 1.27 |
| MVRV Z-Score | 7 | 2.51 | 2.49 | 2.34 |
| Mayer Multiple | 2.5 | 1.19 | 1.14 | 1.19 |
| Mayer Multiple Price Bands | Overbought | Bullish | Bullish | Bullish |
| Golden Ratio Multiplier | 3 | 1.3 | 1.3 | 1.3 |
| SMA 1458 Days (4 Years) | 5 | 2.2 | 1.75 | 1.7 |
| 1Y+ HODL Chart | 15-25% divergence from long-term holders | 12.51% diverg. | 10.8% diverg. | 12.34% diverg. |
| Halving Price Regression | Orange and Red Zone (3-4 years ahead) | Green Zone | Green Zone | Green Zone |
| Bitcoin Long Term Power Law | Midway between Regression Line & Resistance | Below Reg. Line | Below Reg. Line | Below Reg. Line |
| Bitcoin MACD | 5,000+ | 513 | 4,079 | 4,125 |
| Pi Cycle Top Indicator | 111DMA crosses above 350DMA x2 | Moving Towards | Moving Away | Moving Away |
| Thermocap Multiple | 200 | 151 | 141 | 135 |
| Bitcoin Power Law Oscillator | 0.4 | 0.08 | 0.07 | 0.06 |
| Net Unrealised Profit Loss (NUPL) | 75% | 56% | 57% | 55% |
| MVRV Score | 3.8 | 2.29 | 2.31 | 2.21 |
| Ahr999 Index | 3.49 | 1.11 | 1.1 | 1.19 |
| Monthly RSI | 85+ | 73 | 65 | 70 |
Portfolio Rebalance
We’re still below our crypto portfolio cap of 15% of total portfolio value.
Tax Optimisation
All crypto has been held greater than 12 months, other than staking income that is earned on a monthly basis.
Conclusion
There is still plenty of room for this market to run further as we’re nowhere near a cycle peak.
Rebalancing Outcome
From a cashflow perspective crypto and shares are our most liquid asset classes. Given our tight cash balances on deposit we may require some additional cashflow in August so possibly may sell some Solana later this months.