As per our plan around timing the exit of this crypto cycle, outlined below is where the indicators are currently tracking.
Here’s a snapshot of where the key indicators currently sit and what they’re suggesting about Bitcoin’s next moves.
Since Trump’s inauguration, Bitcoin has paused its upward momentum, largely due to shifting macroeconomic conditions. Like the NASDAQ, Bitcoin is a “risk-on” asset, meaning it typically rises when global liquidity expands. More liquidity means more capital flowing into higher-risk investments like crypto.
In late 2024, we saw the start of a tightening in global liquidity conditions, which triggered the sell-off in Q1 2025. However, those conditions have begun to loosen in Q2, sparking a Bitcoin recovery and setting the stage for the third leg of this cycle.
Here are three key macro indicators………courtesy of RealVision, that provide valuable insight into where we are in the Bitcoin cycle:
1. Bitcoin 3Mo3M% vs. GMI Financial Conditions Index
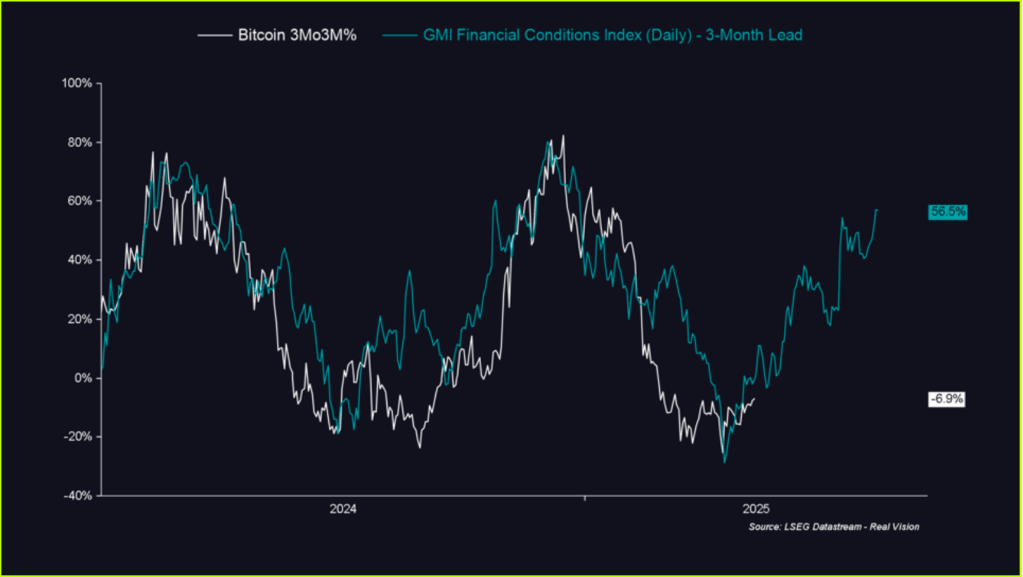
Historically, Bitcoin price action lags financial conditions by about three months. The GMI Financial Conditions Index bottomed in Q4 2024, and Bitcoin followed with a bottom in Q1 2025.
Based on previous patterns, the level of easing we’re seeing now implies that by the end of this quarter, Bitcoin could be up approximately 50%. This isn’t speculation……..it’s a repeatable relationship between easing conditions and delayed price reactions.
As RealVision often reminds us: everything else—tariffs, headlines, noise—is downstream of financial conditions.
2. Global M2 vs. Bitcoin
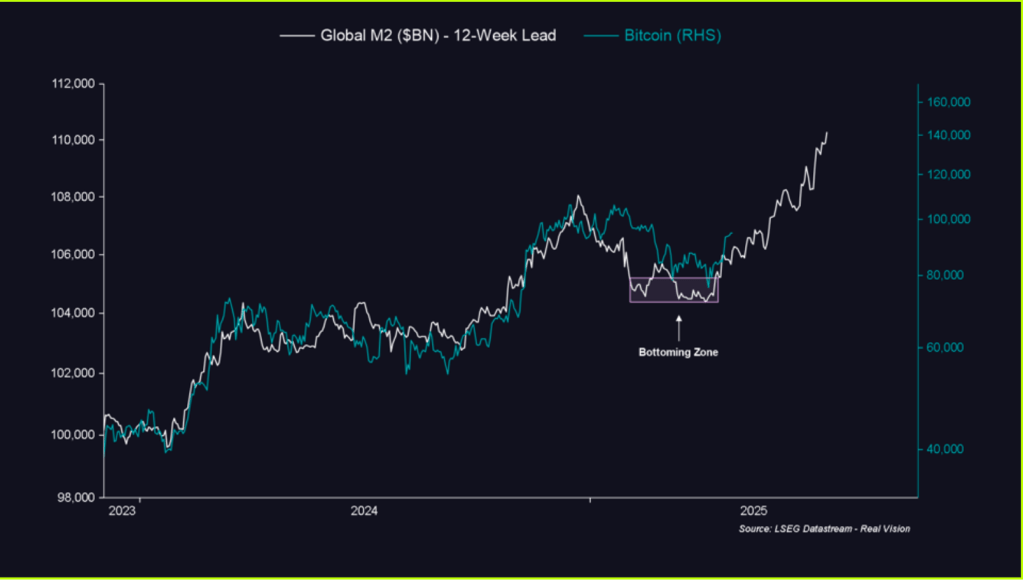
Another strong macro signal comes from the Global M2 money supply. Bitcoin typically lags changes in M2 by around 12 weeks. Global M2 bottomed in late Q4 2024 and began rising in January 2025, putting Bitcoin’s March rebound right on schedule.
If this trend holds, April marked the beginning of the next upward leg……and so far, that’s playing out as expected, with Bitcoin already showing renewed momentum.
3. Bitcoin Cycle Phases: The “Banana Zone”
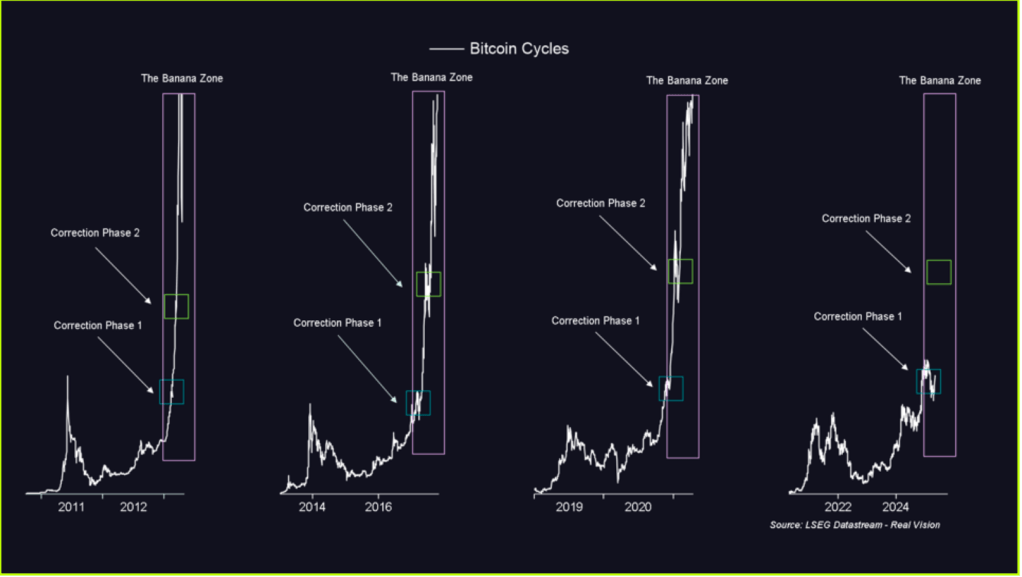
Finally, a look at the historical behavior of Bitcoin itself. According to RealVision, Bitcoin cycles go through identifiable phases—including what they call the “Banana Zone,” where price action turns parabolic.
We’re now entering Phase 2 of that Banana Zone, a stage historically marked by steep upward movement. While short-term pullbacks are part of any healthy cycle, all signs point to the next few months being especially bullish.
Looking at the framework we developed around Bitcoin Tops
Here is a graph that shows where we are in this Bitcoin cycle post-halving compared to other cycles in relation to Bitcoin ATH. Through all previous cycles the BTC price maxed out by the end of the current calendar year.
Current Value of Factors
- Historic Cycle Timings – Still aiming for a cycle peak towards the end of 2025 as can ben seen by this graph.
- Market Sentiment – Google trends over a long term timeframe (since 2017) it currently sits at an estimated 25 which is below the previous 2 peaks (100 in 2017 and 69 in 2021). Until this peaks above 60 over the long term range I believe there is still room to run.
- On-Chain Indicators: At present values, 0 out of 17 indicators have turned on.
| Indicator | Peak Value | Current Values | Feb 15 Values | Jan 15 Values |
|---|---|---|---|---|
| Puell Multiple | 3.5 | 1.37 | 1.27 | 1.11 |
| MVRV Z-Score | 7 | 2.49 | 2.34 | 2.52 |
| Mayer Multiple | 2.5 | 1.14 | 1.19 | 1.29 |
| Mayer Multiple Price Bands | Overbought | Bullish | Bullish | Bullish |
| Golden Ratio Multiplier | 3 | 1.3 | 1.3 | 1.4 |
| SMA 1458 Days (4 Years) | 5 | 1.75 | 1.7 | 1.7 |
| 1Y+ HODL Chart | 15-25% divergence from long-term holders | 10.8% diverg. | 12.34% diverg. | 11.8% diverg. |
| Halving Price Regression | Orange and Red Zone (3-4 years ahead) | Green Zone | Green Zone | Green Zone |
| Bitcoin Long Term Power Law | Midway between Regression Line & Resistance | Below Reg. Line | Below Reg. Line | Below Reg. Line |
| Bitcoin MACD | 5,000+ | 4,079 | 4,125 | 4,534 |
| Pi Cycle Top Indicator | 111DMA crosses above 350DMA x2 | Moving Away | Moving Away | Moving Closer |
| Thermocap Multiple | 200 | 141 | 135 | 137 |
| Bitcoin Power Law Oscillator | 0.4 | 0.07 | 0.06 | 0.07 |
| Net Unrealised Profit Loss (NUPL) | 75% | 57% | 55% | 56% |
| MVRV Score | 3.8 | 2.31 | 2.21 | 2.28 |
| Ahr999 Index | 3.49 | 1.1 | 1.19 | 1.3 |
| Monthly RSI | 85+ | 65 | 70 | 75 |
4. Portfolio Rebalance: We’re still below our crypto portfolio cap of 15% of total portfolio value.
5. Tax Optimisation: from May 5th we now have crypto that is tax advantageous to be sold. This includes both Solana and Sui and allows us to perform strategic sells on a monthly basis moving forward.
Conclusion
Now the macro conditions have formed positive tailwinds for the crypto market we have started to see an improvement in key indicators for Bitcoin. The rally has returned as some of the indicators are now in a better position than what they were in when we last measured them in Feb this year.
There is still plenty of room for this market to run further as we’re nowhere near a cycle peak.
Rebalancing Outcome
From a cashflow perspective crypto and shares are our most liquid asset classes. Given our tight cash balances on deposit we do require some additional cashflow in May so we will be selling a portion of our Solana to cover this.
For tax planning reasons we would like to book some capital gains in prior to the end of the financial year.