As per our plan around timing the exit of this crypto cycle, outlined below is where the indicators are currently tracking.
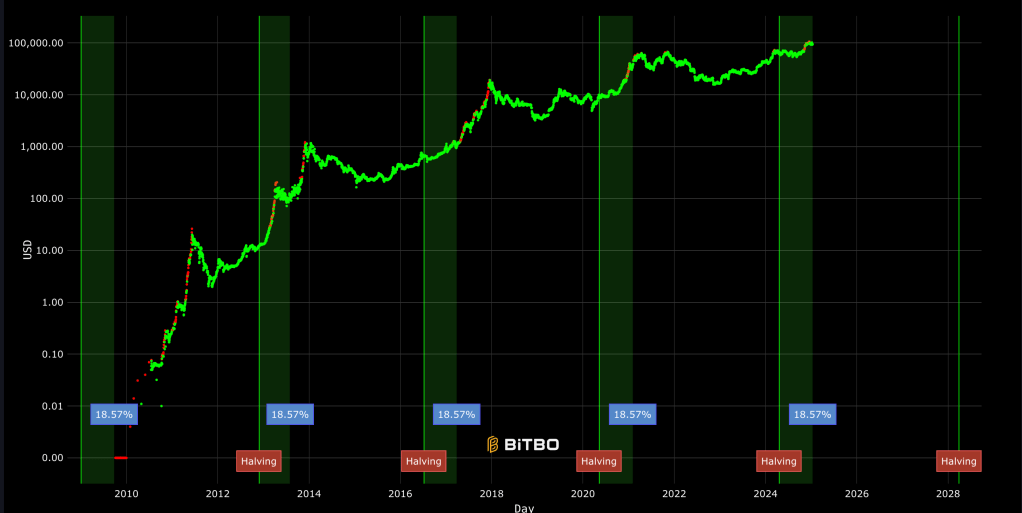
Here is a graph that shows where we are in this Bitcoin cycle post-halving compared to other cycles in relation to Bitcoin ATH. This shows that we should have a few more months at least until a BTC ATH is reached.
Current Value of Factors
- Historic Cycle Timings – Until mid Feb 2025 this factor still is pre-peak as can ben seen by this graph.
- Market Sentiment – Google trends did hit a peak of 100 on Nov 12 on a 30 day timeframe which was then surpassed on December 5th. But over a long term timeframe (since 2017) it currently sits at an estimated 29 which is below the previous 2 peaks and which is below the 55 which was measured 1 month ago.
- On-Chain Indicators: At present values, 0 out of 16 indicators have turned on.
| Puell Multiple | 3.5 | 1.11 | 1.23 | 1.07 |
| MVRV Z-Score | 7 | 2.52 | 3.09 | 2.72 |
| Mayer Multiple | 2.5 | 1.29 | 1.47 | 1.35 |
| Mayer Multiple Price Bands | Overbought | Bullish | Bullish | Bullish |
| Golden Ratio Multiplier | 3 | 1.4 | 1.6 | 1.4 |
| SMA 1458 Days (4 Years) | 5 | 1.7 | 2.2 | 1.75 |
| 1Y+ HODL Chart | 15-25% divergence from long-term holders | 11.8% divergence | 10.9% divergence | 9.3 % divergence |
| Halving Price Regression | Orange and Red Zone (3-4 years ahead) | Green Zone | Green Zone | Green Zone |
| Bitcoin Long Term Power Law | Midway between Regression Line & Resistance | Below Regression Line | Just Passed Regression Line | Below Regression Line |
| Bitcoin MACD | -7,000 to +7,000 | -2,000 to 1,000 | -10,000 to -2,000 | -5,176 |
| Pi Cycle Top Indicator | 111DMA crosses above 350DMA x2 | Divergence Moving Closer | Divergence Moving Closer | Large Divergence |
| Thermocap Multiple | 200 | 137 | 150 | 131 |
| Bitcoin Power Law Oscillator | 0.5 | 0.07 | 0.12 | 0.07 |
| Net Unrealised Profit Loss (NUPL) | 75% | 56% | 62% | 60% |
| MVRV Score | 3.8 | 2.28 | 2.6 | 2.73 |
| Ahr999 Index | 3.49 | 1.3 | 1.59 |
4. Portfolio Rebalance: At present value the crypto portfolio makes up 14.1% of the net value of the portfolio and is below the 15% maximum target.
5. Tax Optimisation: The first trench of crypto could be sold in December 2024.
Conclusion
Over the past 30 days Bitcoin has taken a welcome and healthy breather in relation to the cycle. Most of the key metrics have reverted back to what they were 2 months ago. This was expected as all crypto cycles have local tops and minor sell-offs and consolidations before continuing the bull-run.
We expect that running into Trump’s inauguration should see the market begin to pickup and run into the next local peak around March/April.
Rebalancing Outcome
There will be no rebalancing in January and the portfolio will remain the same.