As the crypto market edges into the anticipated “banana zone” for this cycle, we’re analysing indicators from the past three cycles to better predict the next cycle top. Through our research, we’ve identified a set of 14 critical Bitcoin indicators that we can monitor in real time. When 10 out of these 14 indicators are triggered, we believe this data collectively signals a likely cycle peak.
These indicators range from blockchain activity and miner flows to moving averages, overbought conditions, long-term holders, and overall market cap. Together, they offer a comprehensive view of Bitcoin’s market behavior and help pinpoint peak moments in the cycle.
Here’s a breakdown of the 14 indicators we believe are most predictive of cycle highs.
Puell Multiple
The Puell Multiple is calculated by dividing the daily issuance value of bitcoins (in USD) by the 365-day moving average of daily issuance value.
Previous cycle highs have been reached when this value reaches 3.5.
Current value: 1

MVRV Z-Score
MVRV Z-Score uses blockchain analysis to identify periods where Bitcoin is extremely over or undervalued relative to its ‘fair value’.
Previous cycle highs have been reached when this value reaches 7.
Current value: 1.87

Mayer Multiple
The Mayer Multiple is a metric used to assess Bitcoin’s price in relation to its long-term historical trend.
Previous cycle highs have been reached when this value reaches 2.5
Current value: 1.1

Mayer Multiple Price Bands
Mayer Multiple Price Bands are a visual tool to help understand Bitcoin’s price in relation to its long-term trends. By plotting price levels that correspond to different Mayer Multiple values, these bands provide insights into when Bitcoin might be overvalued or undervalued based on historical behaviour.
Previous cycle highs have been reached when this value reaches: Overbought
Current value: Bullish

Golden Ratio Multiplier
The Golden Ratio Multiplier shows the daily 350-day moving average of Bitcoin’s price and compares it to that average multiplied by the Golden Ratio (1.6) and the Fibonacci sequence (0, 1, 1, 2, 3, 5, 8, 13, 21).
Previous cycle highs have been reached when this value reaches: 3
Current value: 1

Simple Moving Average 1458 Days (4 Years)
the simple moving average for bitcoin for a period of 4 years (1458 days). For each day on the graph we sum prices for the previous 1458 days and divide it by 1458 (the arithmetic average). This period of 4 years is important with Bitcoin because this is the period between two halvings (the time between blocks is 10 minutes and halving is happening every 210,000 blocks, which equals 1,458.33 days). Halvings have a significant impact on the Bitcoin price because they cut daily production in half. The history of the SMA 1458 indicator has proven to show a very reliable support for the bitcoin price.
Previous cycle highs have been reached when this value reaches: 5
Current value: 1.75

1Y+ HODL chart
The 1-YR HODL Wave stat represents the percentage or proportion of Bitcoin addresses (or wallets) that have held their Bitcoin for at least one year without conducting any outgoing transactions.
It gives insights into the behaviour of long-term holders who are willing to keep their Bitcoin investments for an extended period, rather than engaging in short-term trading or frequent buying and selling.
This metric is often used by analysts and investors to gauge the level of confidence and conviction in the Bitcoin market. A higher percentage of long-term hodlers could be interpreted as a sign of strong faith in the long-term potential of Bitcoin as an asset. Conversely, a decrease in the 1-year HODL wave could indicate increased selling activity and potential short-term market sentiment.
Previous cycle highs have been reached when the % of long term Bitcoin holders reduce by 15% to 25% creating a divergence between hodlers and price.
Current value: Around a 7% divergence

The Halving Price Regression
The Halving Price Regression (HPR) is a non-linear regressions curve calculated using only the bitcoin prices on the 3 halving dates. This method excludes the hype cycles to create a conservative trend line. The blue band is on trend (+/- 6 month) with each band above being another year ahead of the trend line. Green = 1 year ahead of trend, Yellow = 2 years ahead, etc.
Previous cycle highs have been reached when the price goes into the Orange and Red Zone which is when BTC price is 3 to 4 years ahead of its estimate.
Current value: Blue Zone within 6 months of price

Bitcoin Long Term Power Law
This chart is derived by taking two bands of bitcoin prices.
– A resistance price above the current price
– A support price below the current price
These resistance and support bands were derived by taking a linear regression of the historical bitcoin price to derive a “power law”. This power law is just a straight line to represent the correlation between bitcoin’s price and time. This line is then perfectly copied (including its slope) twice. With these two new lines,
– One is lowered such that the historical bitcoin price is always equal to or greater than the prices hitting that line – the support line.
– One is raised such that the historical bitcoin price is always equal to or less than the prices hitting that line – the resistance line.
Previous cycle highs have been reached when this value reaches at least half way between the Linear Regression Line and Resistance
Current value: Below the Linear Regression Line

Bitcoin MACD
The MACD (Moving Average Convergence Divergence) is a momentum-based indicator used to assess trend strength and direction, helping traders identify potential buy or sell signals. For Bitcoin, as with other assets, the MACD is particularly valuable in spotting shifts in price momentum over various timeframes.
Previous cycle highs have been reached when the MACD value goes below -7,000 and then it switches to an equivalent 7,000
Current value: -2,000

Pi Cycle Top Indicator
The Pi Cycle Top Indicator signals a potential market top when the 111DMA crosses above the 350DMA x2. This crossing point suggests that Bitcoin’s price might have accelerated too rapidly, potentially indicating a peak in the current cycle.
This behaviour is rooted in the cyclical nature of Bitcoin’s market, where price movements tend to follow a rhythmic pattern. By using this indicator, analysts aim to identify the moments when Bitcoin may be overextended, allowing for more informed decision-making.
Previous cycle highs have been reached when the 111DMA crosses above the 350DMA x2
Current value: Huge divergence

Thermocap Multiple
Take the bitcoin price on a given day and divide by the total historical block subsidy. This total historical block subsidy is calculated by taking the amount of bitcoins minted on each day and multiplying them by the end of day price on that day. Then you add all of these daily subsidies up for every day previous to the one you are looking at.
Previous cycle highs have been reached when the value increases over 200
Current value: 116

Bitcoin Power Law Oscillator
The interpretation of the power law oscillator is pretty straightforward. Market tops correlate with high oscillator values. Market bottoms correlate with low oscillator values. This is seen throughout the price history when back-modeling – each all-time-high was seen in a thin oscillator band. The bubbles then burst not long after entering that band.
Previous cycle highs have been reached when the value increases to over 0.5
Current value: 0.01

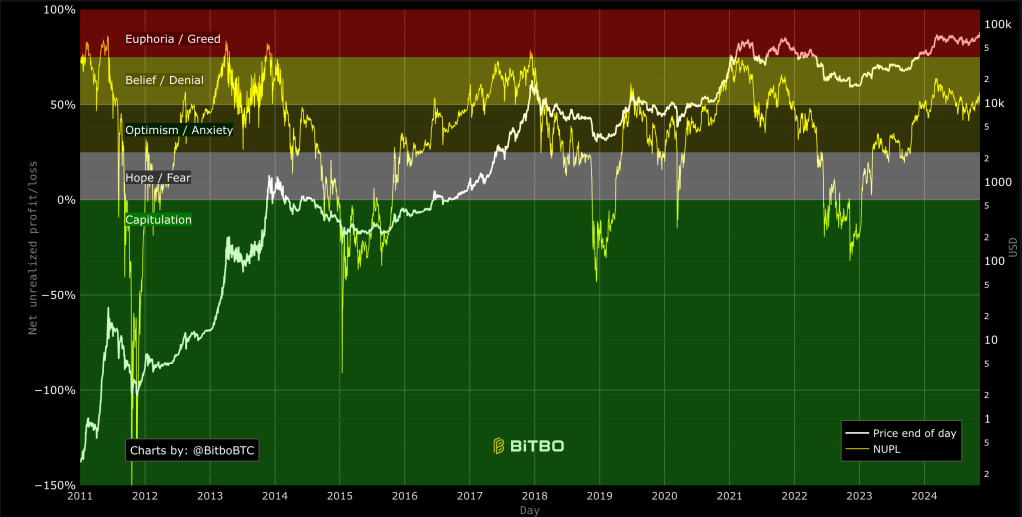
Net Unrealised Profit Loss (NUPL)
The Net Unrealised Profit Loss (NUPL) indicator is a powerful tool for analysing Bitcoin market sentiment and cycles.
It measures the difference between unrealised profits and losses in the market relative to the total market cap.
Previous cycle highs have been reached when the value increases to over 75%
Current value: 56%
Conclusion
In summary, these 14 indicators provide a comprehensive toolkit for identifying potential cycle peaks in Bitcoin’s price. By monitoring a diverse range of metrics — from blockchain activity and long-term holder trends to market sentiment and technical indicators — we can gain valuable insights into the market’s position within the cycle.
Historically, when these indicators align with their typical “cycle high” values, it has signaled an overheated market, suggesting the potential for a price correction. While no single metric is definitive, together they offer a robust framework for understanding Bitcoin’s cyclical behavior and managing risk.
As the market evolves, tracking these indicators in real time will help us anticipate major price shifts and provide a strategic edge in navigating Bitcoin’s dynamic cycles.
At present values, 0 out of 14 indicators have turned on, highlighting there is still a lot to run in relation to price for this Bitcoin cycle.
| Indicator | Cycle High Value | Current Value |
|---|---|---|
| Puell Multiple | 3.5 | 1 |
| MVRV Z-Score | 7 | 1.87 |
| Mayer Multiple | 2.5 | 1.1 |
| Mayer Multiple Price Bands | Overbought | Bullish |
| Golden Ratio Multiplier | 3 | 1 |
| SMA 1458 Days (4 Years) | 5 | 1.75 |
| 1Y+ HODL Chart | 15-25% divergence from long-term holders | ~7% divergence |
| Halving Price Regression | Orange and Red Zone (3-4 years ahead) | Blue Zone |
| Bitcoin Long Term Power Law | Midway between Regression Line & Resistance | Below Regression Line |
| Bitcoin MACD | -7,000 to +7,000 | -2,000 |
| Pi Cycle Top Indicator | 111DMA crosses above 350DMA x2 | Huge divergence |
| Thermocap Multiple | 200 | 116 |
| Bitcoin Power Law Oscillator | 0.5 | 0.01 |
| Net Unrealised Profit Loss (NUPL) | 75% | 56% |